The All India Household Consumption Expenditure Survey 2022-23 report released on 24 February throws up interesting facts and figures about the patterns and preferences of different food items being consumed by rural and urban India. But, its timing and the main drift of the findings raise more questions than give answers. For, the survey has been made public 11 years after the last one. It is usually conducted by the National Statistical Office every five years, but the last report based on the survey in 2017-18 after the botched up Demonetization and implementation of the Goods and Services Tax (GST) was not released. The government cited “data quality” issues to stop its release. The Central government was criticised for not collecting and sharing proper data on the economy. The reason, as it could be justifiably presumed, was to hide from the electorate the stark reality of the havoc played with the country’s economy by the ill-conceived Demonetization and shoddy implementation of the GST regime. The country is again in election mode now and the ruling alliance is in a better position to take on the Opposition. This seems to explain the release of the survey this time around.
There is another weighty reason for the timing of making the survey public. It suits the current dispensation’s agricultural policies and electoral purpose. The farmers’ agitation over legal guarantee of minimum support price for a slew of agricultural items is snowballing and threatening to be the BJP’s Achilles’ heel. The release of the survey and its contents may not only divert the attention from the angry farmers’ agitation, but change the electoral-political discourse in a different gear.
The figures are being interpreted differently by different stakeholders to suit their political interests. But, the stark reality, as revealed by the survey, is that the poorest 5 per cent of India spend, on an average, merely Rs 46 daily in rural areas and Rs 67 in urban areas against the richest 5 per cent whose daily consumption is Rs 350 in rural areas and Rs 700 in urban parts, indicating a huge inequality in incomes.
The latest report showed that although the average Monthly Per Capita Consumption Expenditure (MPCE) in urban households rose to Rs 3,510 – an increase by 33.5 per cent since 2011-12 – and rural households to Rs 2008 that is a 40-42 per cent uptick, the jump is more owing to steep inflationary trends than any real rise in incomes. This is borne out by the fact that the proportion of spending on food, as the survey revealed, slid to 46.4 per cent from 52.9 per cent in 2011-12 in rural households, while it dropped from 42.6 per cent to 39.2 per cent in the corresponding period for urban households. The figure points to two possibilities – either people are cutting down on spending on food because of high retail inflation or have been relieved by the government’s free ration scheme to 80 crore Indians. The MPCE figures are based on data collected from 2,61,746 households, of which 1,55,014 were in rural areas, spread over all states and Union Territories.
Interestingly, Sikkim’s MPCE is the highest among Indian states at Rs 7,731 in rural and Rs 12, 105 in urban households. Chhattisgarh is at the bottom of the ladder where the MPCE is Rs 2,466 for rural and Rs 4,483 for urban households.
A BJP apologist predictably finds the survey results highly encouraging for the country’s state of economy under the current dispensation. The data relied on for this is the household consumption expenditure for the year 2022-23 which shows per capita monthly household expenditure more than doubled in 2022-23 as compared to 2011-12. From this the conclusion that the ruling party draws is that the government’s poverty alleviation measures have been successful.
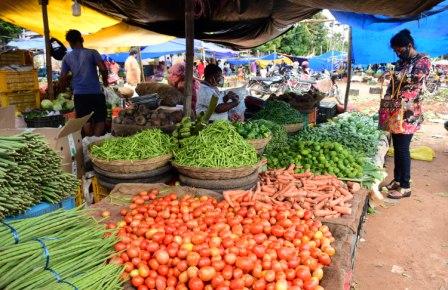
An interesting finding is the kind of food items on which people are spending more or less. The share of cereals and pulses within overall food consumption expenditure has come down both in rural and urban areas. But, the share of spending on milk has increased to an extent that it has overtaken that on cereals and pulses combined in 2022-23. The same also applies to fruits and vegetables, i.e. foods high in vitamins and minerals.
The political implication of these findings is that the demand for a “legal guarantee” to MSP is mainly from farmers of 23 crops, including foodgrains and sugarcane. But the farm sector’s growth is being led by livestock, fisheries and horticulture crops which are outside MSP purview.
All these lead to the inescapable conclusion that one main objective of the release of the survey at a time when the country is getting ready for the general elections is to tell the electorate not to be swayed by the agitation by the farmers who are being described by the Opposition as the country’s “anna data” (giver of food). The people now will have to decide whether they survive on fish and chips or dal and roti and vote accordingly.
