Santosh Kumar Dash and Dinabandhu Sethi
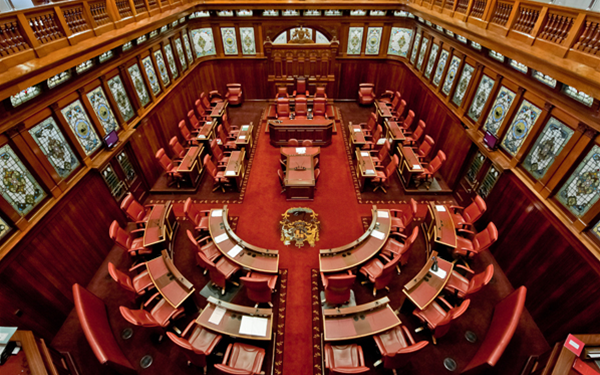
The state Assembly recently resolved to create a legislative council (LC). The Upper House is to come at an annual cost of Rs 35 crore. But does Odisha need an LC? The Chief Minister has argued that an LC could help accelerate the growth of Odisha. This gives the impression that states with bicameral legislatures (BLs) perform better than those with unicameral legislatures (ULs).
But analysis of data from the Handbook of State Statistics of the NITI Aayog and RBI’s Handbook of Statistics on Indian States, starting from 2008, do not support the claim. Data on six states with BLs (Telangana not included) and 23 states with ULs were taken into consideration.
The states were compared first on growth rate of per capita income (per capita NDSP at constant prices) from 2008-09 to 2016-17. The 9-year average growth figures for BL and UL states are 5 per cent and 6.2 per cent respectively.
Consider fiscal deficit and debt for 2008-09 to 2015-16. The average fiscal deficit of BL and UL states are 3.4 per cent and 2.9 per cent as percentage of GSDP respectively. The average debt-to-GSDP ratio stood at 32.1 per cent for BL states and 31.9 per cent for UL states.
Health and level of development are strongly linked. So, let us consider infant mortality rate (IMR) (2008-16), life expectancy at birth (average of 2010-14 data) and vacancy rate of doctors at PHCs (2015). With regard to IMR, the 9-year average of BL and UL states are 39.7 and 34.1 per thousand live births. Although all states have reduced IMR significantly, UL states fare better. Life expectancy at birth for BL and UL states are 69 and 68.9 per cent respectively. Finally, vacancy rate of doctors at PHCs in 2015 for both the BL and UL states were 19.1 and 26 per cent respectively.
Next in line are educational indicators. While the average literacy rate according to Census 2011 is 70.2 for BL states, it is 78.8 for UL states. With regard to dropout rates at primary level, BL states have performed slightly better (6.4 per cent) compared with UL states (7.4 per cent) from 2008-09 to 2010-11. With respect to teacher-student ratio (secondary education) for 2012-13 to 2015-16, UL states (26.1 per cent) outperform BL states (36.2 per cent) by 10 percentage points.
Poverty reduction has been a priority for all states. To compare success of BL and UL states on this subject, the Tendulkar poverty estimates (combined) of 2004-05 and 2011-12 were used. Excluding Andhra Pradesh, which did not have an LC in 2004-05, headcount poverty fell by 11.1 percentage points on average for both categories. The average poverty rate in 2011-12 was 24.9 per cent for BL states while that of UL States was 19.5 per cent.
Infrastructure development is crucial for economic growth of a state. To gauge progress in this sphere, critical inputs namely state highways (in km) and per capita availability of power (kilowatt-hour) for 2008-09 to 2016-17 were assessed. BL states added state highways at annual growth rate of 1.1 per cent, while UL states showed 4 per cent growth. Growth rate of per capita availability of electricity in both categories was the same at 5 per cent. But UL states at 852.6 kWh, outperformed BL states at 766.4 kWh in average per capita availability.
The final points of comparison are in the banking sector. Growth in credit to agriculture for 2008-09 to 2016-17 in BL and UL states are 18.4 per cent and 19 per cent. The figure for growth rate in RRB branches is 3.2 per cent and 3.6 per cent respectively.
If the basic premise is that having an LC accelerates a state’s economic growth, evidence is to the contrary. More research is required into whether adding an Upper House contributes to growth and development. Since there is no strong economic case for having an additional legislature, the state can better spend Rs 35 crore annually on vital areas.
Santosh Kumar Dash is a doctoral scholar at Institute for Financial Management and Research, Chennai. Dinabandhu Sethi is a doctoral scholar at University of Hyderabad.


